The 2018 Bridge Test
Overview
In 2019, the National Center for Health Statistics (NCHS) introduced a large redesign of the NHIS. The 2019 redesign involved:
- a switch from collecting data about all household members to only one randomly selected adult and, if available, one randomly selected child per household;
- an overhaul of the questionnaire instrument; and
- a new approach to generating sampling weights.
A major question raised by the 2019 NHIS is whether it is possible to perform meaningful trend analyses of the pre-2019 and 2019-forward NHIS data. In other words, can one conclude that any differences observed between 2018 and earlier data, and 2019 and later data are "real differences" or are they attributable to changes in data collection and sampling weights?
To provide insight into the answer to this question, NCHS performed a small-scale test to estimate the effect of questionnaire design changes and the effect of sampling weight changes across 19 different health indicators, such as smoking status, unmet need for medical care, and diagnosed hypertension (NCHS 2020). For the test, described in this NCHS working paper, they used data collected during the last calendar quarter of 2018 and over the course of 2019.
Guidance for Users
The results of the 2018 Bridge Test, described in detail below, indicate that comparisons of the pre-2019 and 2019-forward data will not be able to distinguish between "real" changes in prevalence estimates and differences that are an artifact of changes in survey procedures introduced by the 2019 redesign. Based on the results of the Bridge Test, IPUMS NHIS recommends that users do not compare the trends in the pre-2019 with the trends in the 2019-forward data. NCHS has signaled that they plan to release additional evaluation results as more 2019-forward data become available. We will update our guidance based on the findings of any such evaluations.
Back to TopDesign of the 2018 Bridge Test
In order to produce estimates of the effect of questionnaire design changes, NCHS administered the new 2019 questionnaire to a nationally representative sample of 4,428 sample adults surveyed between October and December of 2018 (calendar quarter 4, 2018), known as The Bridge Sample. They then took the difference between prevalence estimates of 19 different health indicators generated using the Bridge Sample data and the prevalence estimates of the same health indicators generated using the remaining 25,417 sample adults surveyed in the fourth calendar quarter of 2018 with the 2018 version of the questionnaire (refer to Figure 1). Comparing estimates derived from data collected during the same time period on persons sampled with identical procedures and produced with sampling weights calculated using the same methodology, but with different questionnaire versions, allowed NCHS staff to reasonably conclude that statistically significant differences between the two prevalence estimates were likely due to changes in the questionnaire.
Back to Top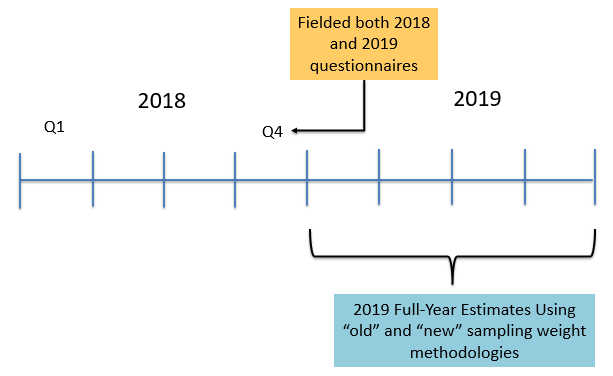
To produce estimates of the effect of changes in sampling weight methodology, NCHS took the difference between prevalence estimates for the same 19 health indicators derived from the full-year early release 2019 data when applying sampling weights generated using the old sampling weight methodology (the "old" weight) and prevalence estimates derived from the same data when applying sampling weights generated using the new sampling weight methodology (the "new" weight). Using the same data but applying different weights allowed NCHS staff to reasonably conclude that statistically significant differences between the two prevalence estimates were likely due to changes in the sampling weight methodology.
The sum of the estimated effect of questionnaire design changes and the estimated effect of the sampling weight methodology changes is interpreted as the combined impact of the 2019 redesign changes.
Back to TopResults
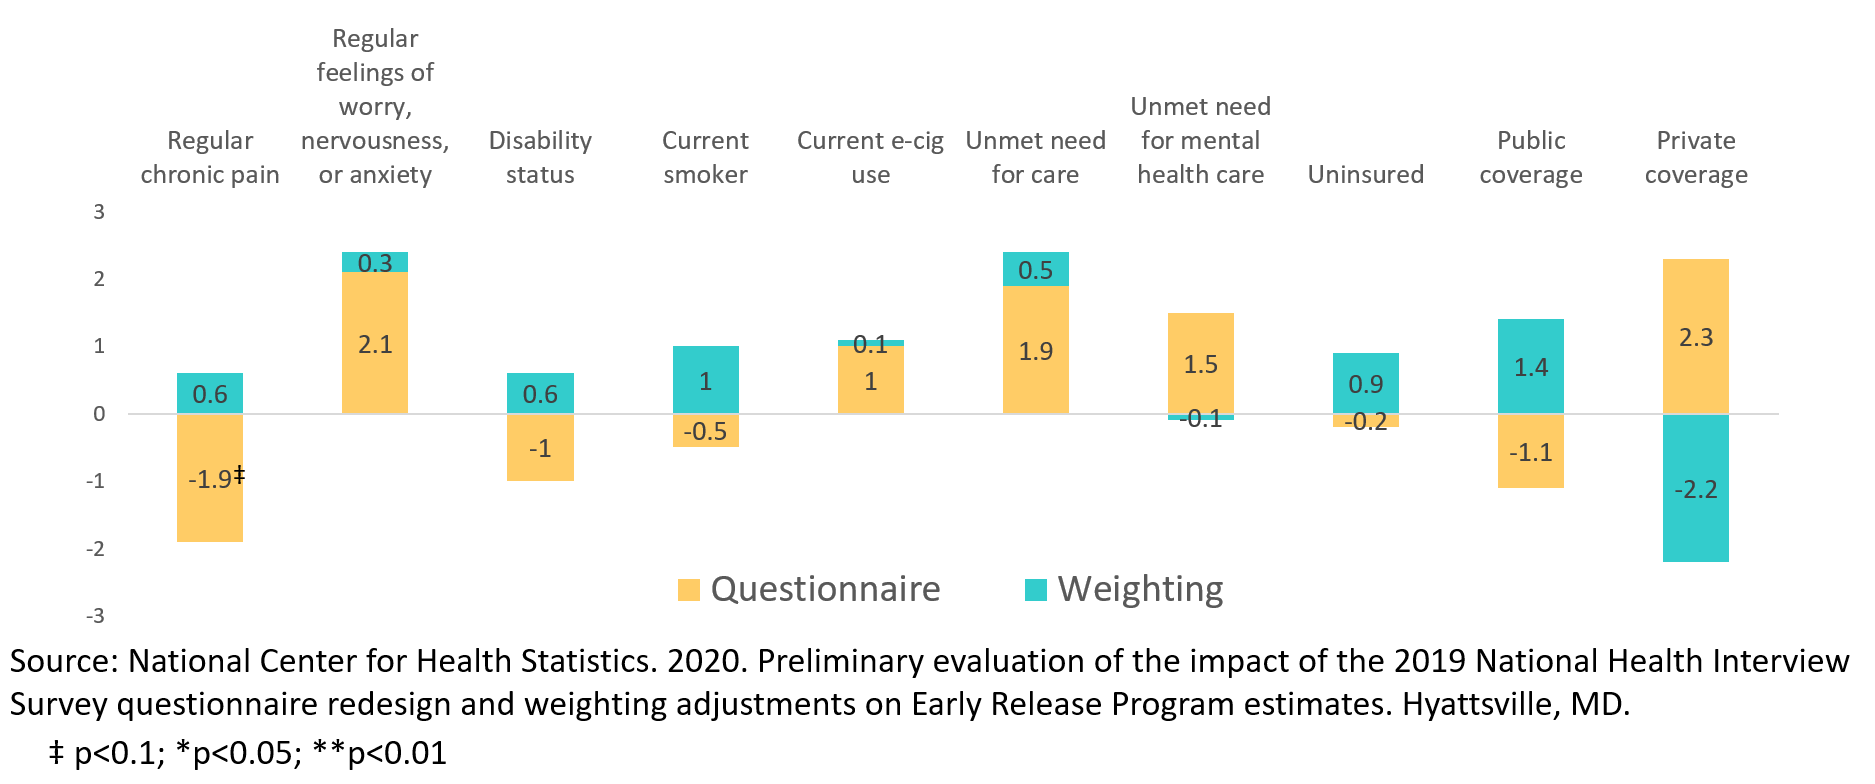
Of the 19 health indicators considered in the Bridge Test, the prevalence estimates for 10 demonstrated statistically significant differences attributable to 2019 redesign changes (refer to Figure 2). Of those 10 indicators, 5 had prevalence estimates that showed statistically significant differences due to questionnaire design changes (regular chronic pain; regular feeling of worry, nervousness, or anxiety; current e-cigarette use; and unmet need for mental health care). One indicator, current smoker, had prevalence estimates that showed statistically significant differences in prevalence estimates due to sampling weight methodology. Two indicators, unmet need for care and private health insurance coverage, showed statistically significant differences in prevalence estimates due to both questionnaire design changes and changes in the sampling weight methodology. Nine health indicators under consideration did not display any statistically significant differences in prevalence estimates due to the 2019 redesign. These included diagnosed hypertension; asthma episode in the past year; regular depression; unmet need for prescribed medications; doctor visit in the past year; emergency room visit in the past year; flu vaccination in the past year; blood pressure check in the past year; and lived in a wireless-only household.
Supported By
![]()
![]()
![]()
![]()